|
 Video: Understanding PE Ratios Video: Understanding PE Ratios
|
|
|
Cheap Stocks Ranking Algorithm
Is a stock trading at a penny "cheaper" than a stock trading at $100? While the penny stock may trade at a lower per-share price, the true answer to the question comes down to a comparison of valuation. Because suppose the penny stock has a history of negative earnings, whereas the $100 stock has been consistently earning $50/share? All of a sudden the $100 stock sure looks cheap, doesn't it!?
The reality is that there are many ways to compare stocks in ways that illuminate whether stock A is cheaper than stock B. And the stock market is chock full of people performing those comparisons every day, in their own chosen ways. Given such a competitive playing field, how is this website, CheapStocksChannel, to stand out? We aim to do so with data, and with a thoughtful ranking algorithm comparing stock prices against underlying per-share earnings.
Here's the scoop on what our algorithm looks at.
First and foremost, we look at the all-important historical earnings of a company. And we then compare that history against the historical stock price information to discern historical average PE multiples for the stock. With that history in hand to compare to, we then consider the stock's present / most-recent earnings information.
For one, there's the most recent quarterly EPS number. Weighing one single quarter has to be done thoughtfully, because on the one hand, a stellar single quarter could be a sign of great things to come for a company... but on the other hand, many companies have a degree of "seasonality" to their earnings reports. So to take the most recent quarter (MRQ) earnings number and annualize it, can provide an interesting denominator for a price/earnings calculation.
But another approach is to consider a company's trailing twelve months (TTM) earnings total — i.e. instead of annualizing just the most recent quarter, why not look back over the last four quarters and total up those earnings? Using that earnings value in a price-to-earnings calculation arguably provides an important look at what a given company was actually able to earn over a year-long period.
And then because earnings reports can often include "lumpy" or one-time write-ups and write-downs, we also take a third approach: we look at the reports over the past four earnings quarters for a company, "toss out" the highest, "toss out" the lowest, and then take the average of the remaining two "middle ground" earnings numbers over the trailing four periods. The result? This exercise finds the median of the trailing twelve month period: the line at which the company has reported earnings higher than the line 50% of the time, and also has reported earnings lower than the line 50% of the time. We then annualize that median number, for use in yet another PE Ratio calculation.
Armed with these various ways to calculate a price/earnings multiple, and knowing the stock's historical average multiples, we can then perform a rank across our coverage universe — but we add in some additional criteria too. For one, we consider each company's size, as measured by its market cap history. If stock A and stock B are hypothetically equal on a PE ranking basis, but A has a $500 million market cap while B has a $5 million market cap, we consider the larger company to be a better value — because smaller companies are inherently more risky and unpredictable.
Finally, for dividend paying stocks, we make some additional calculations. Knowing the various earnings numbers that we calculated for each company — MRQ annualized, TTM EPS, and median TTM earnings annualized — we are able to compare that earnings level against the level of the dividend. In essence, the dividend payout ratio. This allows for a more complete look at the dividend yield... Because suppose you have two stocks each trading at the same 5% yield, where company A is paying dividends at the rate of $1/share and earning $2/share, while company B is also paying dividends at the rate of $1/share but earning just .80. We want our ranking algorithm to consider the 5% yielder with the low payout ratio (company A) to be superior to the 5% yielder under-earning their dividend (company B).
So there you have it: that's the scoop on our ranking algorithm and what it looks at. After ranking our entire coverage universe, we then apply additional screening criteria — such as looking sector-by-sector — to bring you dozens of different "cheap stock lists" to explore.
Notes: when examining past earnings history for a stock, negative earnings are considered not meaningful towards a price to earnings calculation and such results are discarded in the analysis; similarly, a resulting PE ratio based off of a very small earnings number that produces an exorbitantly high PE number above a threshold (we use 500), is also discarded as not meaningful. Also note: the earnings data we receive can be a variety of net income, adjusted EPS, and even FFO in the case of real estate investment trusts, so in order to see additional details for the specific earnings history our algorithm used, please click through on the earnings history chart for that stock to reach the details. Finally: while all of our data partners make their best efforts, there is no guarantee that the information we utilize for this site will be free of errors; indeed, all information should be checked with other sources before acting, and any information presented here should be considered strictly for informational purposes to generate research ideas, and nothing you read here is investment advice nor is it a recommendation to buy or sell any particular security. Please see our full disclaimer information.
|
Although many of the shares listed in our coverage universe fit cleanly into a category like Financials or Utilities, others are either categorized as Miscellaneous, or not categorized at all — these sometimes-overlooked candidates make for good cheap shares to know about.
Read more →
This screen of cheap consumer shares takes our main ranking result and then from there looks for the specific companies in the Consumer sector.
Read more →
First, as a starting point, we take our main ranking result; from there we zero in on the Services sector, to bring you this list of cheap Services shares.
Read more →
Maybe you've heard cheap utilities shares described as "boring" but for so many of us, we relish the dividends often generated by the simple and predictable business models that can be found among Utilities companies.
Read more →
Healthcare is an important sector not only to investors, but to society at large. In this screen, we begin with our main ranking result and then look specifically by sector, to bring you this list of cheap healthcare shares.
Read more →
Financials are one of the largest and most important sectors, and successful companies in this sector often pay dividends. Presented here are the cheapest financials shares among companies categorized into this sector.
Read more →
Technology drives the future, and most investors pay especially close attention to this sector. As a result, cheap technology shares can be hard to find. To help you, we've screened through to our coverage universe to uncover potentially cheap technology shares to consider putting on your radar screen.
Read more →
From a starting point of our main ranking result, we then narrow down to the Industrials sector, to bring you this list of cheap Industrial shares.
Read more →
This screen for cheap materials shares first takes our main ranking result and from there looks for only the specific companies categorized in the Materials sector.
Read more →
There are many interesting of types of energy companies are out there, including oil & gas, solar power, and pipelines. Here we present a list of cheap energy shares you should be looking at right now.
Read more →
Chimera Investment is a holding company. Through its subsidiaries, Co. is a real estate investment trust that is engaged in the business of investing directly or having an interest in a portfolio of mortgage assets, including residential mortgage loans, mortgage-backed securities (MBS) secured by pools of residential mortgage loans and are issued or guaranteed by a federally chartered corporation, such as Federal National Mortgage Association or Federal Home Loan Mortgage Corporation, or an agency of the U.S. Government, such as Government National Mortgage Association (collectively, Agency), and residential MBS that are not guaranteed by any agency of the U.S. Government or any Agency. More details at:
http://www.chimerareit.com.
Should Chimera Investment shares be given the
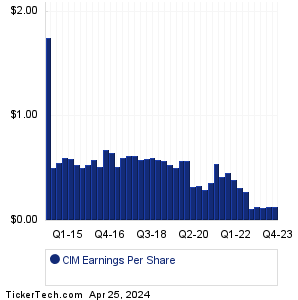
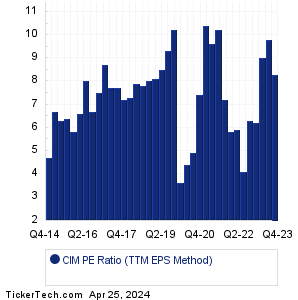
Cheap Dividend Stocks Below $5 label? To start, we see that the recent trading price for CIM stock is $4.24 and the dividend yield is 10.38% (as of 5/8/2024). The most recent quarter's (MRQ) earnings result, annualized, was $0.52/share. Looking at the sum total of quarterly earnings across the trailing twelve month (TTM) period, Chimera Investment produced $0.51/share. And taking the median quarterly result across the TTM period, and annualizing it, results in $0.52/share. Comparing the current indicated annual dividend rate of $0.44 against that median result, we calculate a dividend payout ratio of 84.6%. Comparing the company's various earnings metrics against the stock price, we end up with a PE ratio of 8.2 for the TTM Median method, 8.2 for price to earnings using MRQ annualized, and 8.3 for current price/TTM earnings. Based on CIM's history, that recent TTM PE is elevated relative to the historical average, with the recent PE 13.7% higher than the average (TTM method) of 7.3.
#9. Braemar Hotels & Resorts
#9. Braemar Hotels & Resorts
Braemar Hotels & Resorts invests in hotels and resorts. Co. conducts its business and owns substantially all of its assets through its operating partnership, Braemar Hospitality Limited Partnership. Co. operates in the hotel investment segment of the hotel lodging industry. Co. owns interests in hotel properties in several states, the District of Columbia and St. Thomas, U.S. Virgin Islands, excluding those attributable to its joint venture partner. The hotel properties in Co.'s portfolio are mainly located in U.S. urban and resort locations. Co. owns most of its hotel properties, and the remaining hotel properties through an investment in a majority-owned consolidated joint venture entity. More details at:
http://www.bhrreit.com.
Should Braemar Hotels & Resorts shares be given the
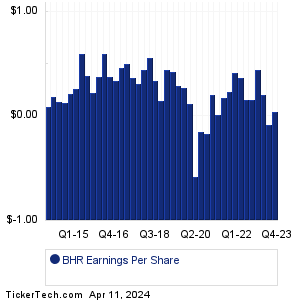
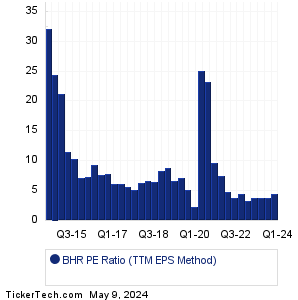
Cheap Dividend Stocks Below $5 label? To start, we see that the recent trading price for BHR stock is $2.59 and the dividend yield is 7.72% (as of 5/8/2024). The most recent quarter's (MRQ) earnings result, annualized, was $0.16/share. Looking at the sum total of quarterly earnings across the trailing twelve month (TTM) period, Braemar Hotels & Resorts produced $0.60/share. And taking the median quarterly result across the TTM period, and annualizing it, results in $0.48/share. Comparing the current indicated annual dividend rate of $0.20 against that median result, we calculate a dividend payout ratio of 41.7%. Comparing the company's various earnings metrics against the stock price, we end up with a PE ratio of 5.4 for the TTM Median method, 16.2 for price to earnings using MRQ annualized, and 4.3 for current price/TTM earnings. Based on BHR's history, that recent TTM PE is low relative to the historical average, with the recent PE 53.3% lower than the average (TTM method) of 9.2.
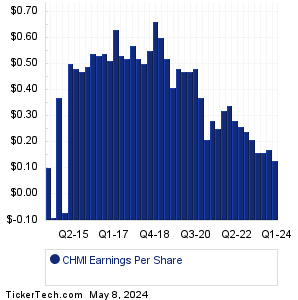
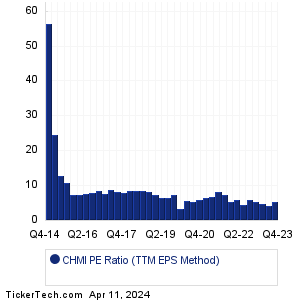
Cherry Hill Mortgage Investment is a holding company. Through its subsidiaries, Co. is a real estate investment trust. Co. is a residential real estate finance company focused on acquiring, investing in and managing residential mortgage assets in the U.S. Co. is externally managed by Cherry Hill Mortgage Management, LLC, an investment adviser. Co. operates its business through the following segments: investments in residential mortgage-backed securities (RMBS) and investments in Servicing Related Assets. Co.'s primary targeted asset classes consist of: RMBS, including Agency RMBS; and Servicing Related Assets consisting of mortgage servicing rights (MSRs) and Excess MSRs. More details at:
http://www.chmireit.com.
Should Cherry Hill Mortgage shares be given the
Cheap Dividend Stocks Below $5 label? To start, we see that the recent trading price for CHMI stock is $3.52 and the dividend yield is 17.05% (as of 5/8/2024). The most recent quarter's (MRQ) earnings result, annualized, was $0.52/share. Looking at the sum total of quarterly earnings across the trailing twelve month (TTM) period, Cherry Hill Mortgage produced $0.62/share. And taking the median quarterly result across the TTM period, and annualizing it, results in $0.64/share. Comparing the current indicated annual dividend rate of $0.60 against that median result, we calculate a dividend payout ratio of 93.8%. Comparing the company's various earnings metrics against the stock price, we end up with a PE ratio of 5.5 for the TTM Median method, 6.8 for price to earnings using MRQ annualized, and 5.7 for current price/TTM earnings. Based on CHMI's history, that recent TTM PE is low relative to the historical average, with the recent PE 35.2% lower than the average (TTM method) of 8.8.
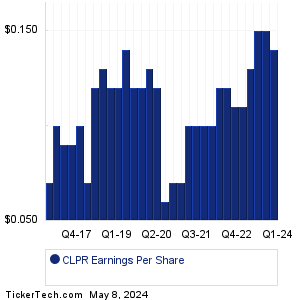
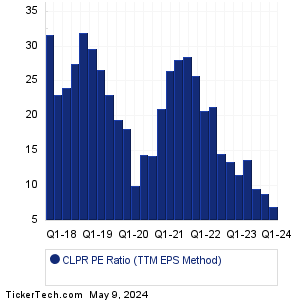
Clipper Realty is self-administered and self-managed real estate company that acquires, owns, manages, operates and repositions multifamily residential and commercial properties in the New York metropolitan area, with a portfolio in Manhattan and Brooklyn. The properties owned by Co. consist of the following: Tribeca House in Manhattan, Flatbush Gardens in Brooklyn, 141 Livingston Street in Brooklyn, 250 Livingston Street in Brooklyn, Aspen in Manhattan, Clover House in Brooklyn, 10 West 65th Street in Manhattan, 1010 Pacific Street in Brooklyn and 953 Dean Street in Brooklyn. More details at:
http://www.clipperrealty.com.
Should Clipper Realty shares be given the
Cheap Dividend Stocks Below $5 label? To start, we see that the recent trading price for CLPR stock is $4.06 and the dividend yield is 9.36% (as of 5/8/2024). The most recent quarter's (MRQ) earnings result, annualized, was $0.56/share. Looking at the sum total of quarterly earnings across the trailing twelve month (TTM) period, Clipper Realty produced $0.57/share. And taking the median quarterly result across the TTM period, and annualizing it, results in $0.6/share. Comparing the current indicated annual dividend rate of $0.38 against that median result, we calculate a dividend payout ratio of 63.3%. Comparing the company's various earnings metrics against the stock price, we end up with a PE ratio of 6.8 for the TTM Median method, 7.2 for price to earnings using MRQ annualized, and 7.1 for current price/TTM earnings. Based on CLPR's history, that recent TTM PE is low relative to the historical average, with the recent PE 64.9% lower than the average (TTM method) of 20.2.
Sirius XM Holdings operates two complementary audio entertainment businesses through its wholly owned subsidiary, Sirius XM Radio Inc. (Sirius XM), and Sirius XM's wholly owned subsidiary, Pandora Media, LLC (Pandora). Co.'s Sirius XM business features music, sports, entertainment, comedy, talk, news, traffic and weather channels and other content, as well as podcasts and infotainment services, on a subscription fee basis. Co.'s Pandora business operates a music, comedy and podcast streaming discovery platform, providing a personalized experience for each listener wherever and whenever they want to listen, whether through mobile devices, car speakers or connected devices. More details at:
http://www.siriusxm.com.
Should Sirius XM Holdings shares be given the
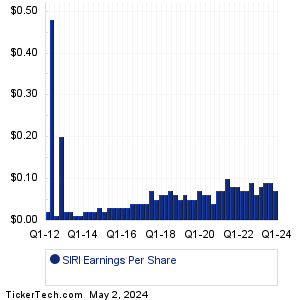
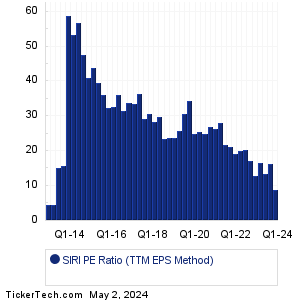
Cheap Dividend Stocks Below $5 label? To start, we see that the recent trading price for SIRI stock is $3.08 and the dividend yield is 3.45% (as of 5/8/2024). The most recent quarter's (MRQ) earnings result, annualized, was $0.28/share. Looking at the sum total of quarterly earnings across the trailing twelve month (TTM) period, Sirius XM Holdings produced $0.33/share. And taking the median quarterly result across the TTM period, and annualizing it, results in $0.32/share. Comparing the current indicated annual dividend rate of $0.11 against that median result, we calculate a dividend payout ratio of 33.2%. Comparing the company's various earnings metrics against the stock price, we end up with a PE ratio of 9.6 for the TTM Median method, 11.0 for price to earnings using MRQ annualized, and 9.3 for current price/TTM earnings. Based on SIRI's history, that recent TTM PE is low relative to the historical average, with the recent PE 66.5% lower than the average (TTM method) of 27.8.
While many of the stocks in our coverage universe fit cleanly into a category like Financials or Utilities, others are either categorized as Miscellaneous, or not categorized at all — these sometimes-overlooked candidates make for good cheap stocks to watch.
Read more →
This cheap consumer stocks screen takes our main ranking result and then looks for the specific companies in the Consumer sector.
Read more →
From a starting point of our main ranking result, we then zero in on the Services sector, to bring you this list of cheap Services stocks.
Read more →
While utilities have often been described by certain investors as "boring" we love the simple and predictable business model of most Utilities companies — plus, they quite often pay juicy dividends!
Read more →
Healthcare is such an important sector — to society, and also to investors. In this screen, we begin with our main ranking result and then look specifically by sector, to bring you this list of cheap healthcare stocks.
Read more →
One of the largest and most important sectors, Financials are often dividend paying companies which is certainly very appealing. Here are the cheapest financials stocks among companies categorized into this sector.
Read more →
Technology continues to change all of our lives, and most investors pay especially close attention to this sector. As a result, cheap technology stocks can be hard to find; but we've screened through to uncover candidates that should be on your radar screen.
Read more →
Beginning with our main ranking result, we then zero in on the Industrials sector, to bring you this list of cheap Industrial stocks.
Read more →
This materials stocks screen first takes our main ranking result and from there looks for only the specific companies categorized in the Materials sector.
Read more →
Energy powers everything, and this sector is especially popular with investors. Lots of types of energy companies are out there, such as oil & gas, pipelines, and solar. Here we present a list of cheap energy stocks you should know about.
Read more →
With a $20 bill, can you buy 1 share of stock right now? Across our coverage universe of tickers, only a subset of companies have stocks with per-share trading prices that are cheap enough to be able to answer "yes" to the question of whether for a 1 share order, they are cheap enough stocks to buy now under $20. Here they are, ranked by our cheap stocks algorithm according to which ones have the most interesting earnings picture, in relation to their trading prices.
Read more →
We went looking for cheap shares, by ranking our coverage universe of publicly traded companies according to ones have the most interesting earnings picture, in relation to their trading prices. Then we answered a second question: for which stocks could an investor actually buy at least one share, with a $20 budget?
Read more →
We're always on the hunt for low priced stocks, and we also want value: each day we rank our coverage universe of public companies according to a ranking algorithm that looks for ones that have the most interesting earnings picture in relation to their share prices. For this screen we then answered a second question: for which stocks could an investor actually buy at least one share, with a $10 budget? Please enjoy this resulting list of cheap stocks under $10.
Read more →
We love to screen for low price stocks, and we also want value — we want the lowest PE stocks we can find. So, each day we rank our coverage universe of stocks according to an internal ranking algorithm that hunts for companies that have the most promising looking earnings picture in relation to their share prices. And then for this particular screen we also asked a second question: which stocks out there are so low in price that a trader could actually buy at least one share, with a mere $5 to spend? Please enjoy this resulting list of cheap stocks under $5.
Read more →
For some traders, it doesn't matter if a stock is trading at $5 or $500 per share — they just adjust their trade to purchase more or less shares to accommodate their budget. But what about those traders who are working with less than $500? Less than $100? How about only $20? With a $20 bill, which stocks out there are low priced enough, that we could actually buy at least one share? Across our coverage universe of tickers, only a subset of companies have low price stocks that can be bought right now under $20 per share. Here they are, ranked by our cheap stocks algorithm.
Read more →
Ask certain investors, and they'll tell you it doesn't matter to them what the per-share price of a stock currently is, all that matters is the underlying value. But there are also those who want to squirrel away small dollar amounts at a time! For this screen, we are looking specifically for low price stocks under $10 per share.
Read more →
Many investors give importance to the $5/share mark. In this screen, we look for low price stocks under $5 per share, ranked by our internal look at price versus EPS.
Read more →
Stock market watchers often group stocks into one of two categories: "Growth Stocks" or "Value Stocks" (although in reality sometimes those lines can be blurry). But for this screen, we've zeroed in on companies that have been dubbed "Growth Stocks" — and among those, we've looked at current PE, historical PE, and several other factors, to bring you this resulting list of cheap growth stocks.
Read more →
Financial advisors sometimes push their clients to invest in companies categorized as "Growth Stocks" — especially those investors with a very long time horizon for investment, who can squirrel away shares and check back on them decades later. Such investors are always on the lookout for good cheap growth stocks to buy. With this screen, our aim is to give you a research tool to help you answer that question!
Read more →
Across our entire coverage universe, with every stock included and none left out, which stocks does our ranking algorithm highlight as potentially being the cheapest stocks right now? Check out this screen to find out!
Read more →
Which stocks, by reputation, have risen to the top? Which stocks are cheap right now? The intersection of these two questions brings us this next screen: we start with components of the S&P 500 (one of the top indices a stock can belong to) and from there our ranking algorithm examines earnings history and price versus EPS (i.e. PE Ratio) information to bring you the top cheap stocks out there today.
Read more →
When stocks see their trading prices become low enough relative to the underlying business value, many stock market analysts will dub such shares as "Value Stocks." In this screen, we start with stocks widely deemed as being "Value Stocks" and then we look at EPS history and PE data as a measure of cheapness — resulting in this list of cheap undervalued stocks.
Read more →
Many stock market participants will dub stocks with low valuations as being "Value Stocks." Which of those value stocks are the "Best?" While the answer to that is subjective, we'll answer with a couple of our own criteria: (1) must pay a decent dividend, and (2) must look attractive on a price/earnings basis. Please enjoy this resulting screen of the best value stocks today.
Read more →
Midcap stocks have great appeal as investments, because they're big enough to be truly substantial businesses, yet they are not so huge that they have run out of room to grow.
Read more →
Which cheap stocks have the most potential? We answer that question this way: the businesses should be large enough to already stand out, yet small enough that they still have the potential to grow. Sort of a "not too big, not too small" stock... one that is "just right" in size. And, one that looks cheap relative to underlying EPS.
Read more →
Many investors love to focus on smallcap stocks because their smallish size means that even if they were to explode, they'd still be at a reasonable level.
Read more →
When the word "blue chip" is used to discuss stocks, the components of the Dow Jones Industrial Average immediately come to mind. Which are the most cheap right now? We aim to answer that question, with the following screen for cheap blue chip stocks.
Read more →
Technology is one of the biggest drivers of our present society, and the biggest names in tech are usually components of the Nasdaq 100 index. We've screened through those components to uncover potentially cheap tech stocks to consider putting on your radar screen.
Read more →
The Nasdaq 100 contains many of the biggest names in technology. For this screen, we've looked specifically at Nasdaq 100 components to uncover potentially cheap Nasdaq stocks to research further.
Read more →
Among the components of the Standard and Poors 500 index, which are the cheapest stocks today? Our algorithm ranked these 500 stocks according to a variety of PE Ratio criteria, to bring you this list of the cheapest stocks today in the S&P 500.
Read more →
Real estate investment trusts, or REITs for short, are a great way to invest in real estate (or real estate linked instruments like mortgages) via a publicly-traded entity, because they offer the liquidity of the public markets and the benefits of private real estate ownership — benefits like collecting rent (or interest payments), with profits often passed along to investors in the form of distributions. For this screen we present cheap REIT stocks paying dividends to explore!
Read more →
We went looking for cheap dividend stocks by ranking our coverage universe of publicly traded companies according to ones have the most interesting earnings picture, in relation to their trading prices. Then we asked a second question: which of those pay a decent dividend?
Read more →
Most ATMs dispense only $20 bills. If you wanted to find cheap dividend stocks to buy, where you could purchase at least 1 share of stock right now with a $20 bill, are there any candidates? With this screen, we aim to answer that question.
Read more →
Many dividend investors focus on yield, and the per-share price doesn't much matter to them. But there are also investors out there who want to squirrel away small dollar amounts at a time, and love to buy dividend stocks! So for this screen, we aim to help such investors by presenting cheap dividend stocks under $10 per share.
Read more →
Many traders and investors ascribe a certain importance to the $5/share threshold. For this screen, we went looking for cheap dividend stocks under $5 per share.
Read more →
Which cheap dividend stocks today are the "Best?" While the answer to that question is subjective, we'll answer it here with a couple of our own criteria: (1) stellar dividend history of unbroken dividend payments to shareholders each year, and (2) must look attractive both on a yield basis and on a price/earnings basis. Please enjoy this resulting screen of the best cheap dividend stocks today.
Read more →
While some investors hold onto cash for long periods waiting for just the right time — that once-a-year buying opportunity — others simply want to invest their cash when it is available, and are constantly on the lookout for the best cheap dividend stocks to buy right now. With this next screen we aim to help those investors by looking for the best cheap dividend stocks to buy today, screening for ones with long unbroken dividend histories and attractive current value.
Read more →

 This Cheap Dividend Stocks Below $5 slideshow page last updated 5/8/2024